Context: April, 2018 I invested in a company I never heard of but I knew enough about both industries in which it operated to believe it was a decent bet. On August 17, 2018, my knowledge of trends within those industries had paid off; $6,445 turned into $11,679. Pretty good for a novice. Beginner’s luck? Nope. While I was able to dedicate the time with the limited funds in my IRA account I actively traded for ten months to test if I could replicate this success. TLDR: I did.
Developing a Trading Strategy: After reading a few chapters on day trading I developed an approach I would try out. In practice realized I was too risk-averse to day trade and held on to equities longer. I had no other help except Fidelity seminars on how to use their products and general market guidance. By January 2019 I had internalized a trading tactic that I would later learn was a combination of two established strategies: swing investing and event-driven investing. I only traded securities that followed my environmental social governance values. In order to apply my recent learning of Tableau I decided to chart the trend analysis I performed on the fly to quantify how I was trading. What follows is an explanation of how I analytically approached my hobby to earn a 74% ROI on my portfolio.
How I Traded Ahead of the Curve: Once I had developed a logic to anticipate when to buy or sell I starting tracking 30+ different stocks to identify when their value was below their historical norms. I used price information to track hourly, daily, weekly, and quarterly trends to anticipate when to time my trades.

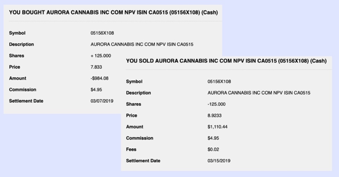
The Tableau chart labelled “Weekly Trend Line” tracks the weekly average and median open stock prices over the course of a trading opportunity timeframe. In this particular instance, I had been tracking this stock and I did purchase ACB at $7.83 on 3/5/19 after the stock had started falling again after it peaked twice. Since this data (and the chart) didn’t exist before I sold that stock for $8.92 on 3/13/19, the 13% gain I secured was relatively safe as it was ahead of the flattening of the curve for this period and in line with the guidance of the long run regression curves in the weekly data chart. Please note settlement dates occurred two days after the attempted stock transaction. I also used other metrics and signals as well to inform my trades. The swings of the market across the days of the week can reveal patterns about when a stock might be at its lower or upper price range.

As can be seen in the “Weekday Trends” chart between 1/21/19 to 7/16/19, dips in ACB’s stock price tend to happen on Tuesday and Friday, while increases happen on Mondays and Wednesday. The date of my purchase, 3/5/19, indeed was on a Tuesday and the sell date, 3/13/19 was on a Wednesday.
When trading, cents, micro-seconds, and volume matters. As exhibited in the “Time of Day Trends” chart clear tendencies across the time of day are apparent for ACB. Trading volume is highest during the earlier hours of the day however noticeably higher stock price values happen toward the end of the trading day. The temporal sweet spot about when to actually execute a trade is better identified with this kind of chart.

The last thing any investor wants is a trade offer that does not happen because there isn’t enough volume. Volume also reflects market momentum and whether any particular rally is in full steam or declining. The way I’ve determined when to buy or sell is by looking at recent volume of trades against different price intervals. This identifies when a critical trade volume is reached.

For this trade, the dark blue in the “Price-Volume Distro – Daily” chart identifies the price level when the most trades happen on any given day. This doesn’t necessarily identify the price at which I would sell the stock. It identifies the limit that I would set when selling the stock. In this case the safest limit seems to be $9.00. However, I wasn’t happy with knowing only that much. Because when you are looking at the stock ticker running, the risk vs. the financial FOMO factor is high. Any incremental ticker movement on the day you intend to sell is another piece of information and also another opportunity to trade that has just gone by.
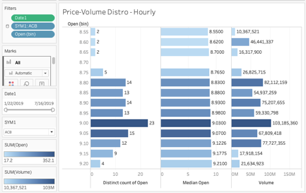
Knowing exactly how close to $9.00 you want to get to safely trade matters on the day you believe your trade needs to happen, and especially before the trading volume falls off on that day. This is why I also consider hourly trade volumes according to different price value increments. It helps me decide if a stock’s movement from $8.50 to $8.89 means I should hit sell or if waiting for more incremental price movement after price increases from $8.50 to $8.55. In most cases the smallest price value increment I use is $.05 since it’s easier to do the math while the ticker is quickly moving up and down throughout the course of the day. As you can see in the “Price-Volume Distro – Hourly” chart, a $.05 increment reveals that between $8.80 to $9.00 there’s a strong chunk of trade volume that provides a good window during which there’s time to safely trade before the price could have started to decline. From the few chapters I read, I gathered that it’s better to target a trade in this zone of price movement, just before the curve goes negative instead of afterwards. You might not realize as much profit in the short term, but you end up making more secure gains over the long term when you are actively trading.
A hobby: I hadn’t actively managed a portfolio before 2018. I enjoyed learning how to analyze stock market trends, trade, and systematically chart my trading approach. I was not trading professionally, though I was proud enough of my success for it make on my LinkedIn profile. This was more of a hobby upon which I focused while I took courses in financial accounting, statistics, economics, and also a great application of my new Tableau skills. Once I developed it, I didn’t continue to trade because I didn’t have time. Even though this was just a hobby I practiced for 10 months, my portfolio still grew 74%, while learning how to trade. This is multiples higher than most average annual portfolio growth rates I have read about 6-12%.
Why Have I Revealed My Approach to Managing My Portfolio: I can’t share the commercial research I’ve performed over 10 years, so I shared what I learned to do on own to exhibit a self-directed interest in learning about the finance sector. I’ve never taken a course in stock trading. I developed a research approach, learned new skills, and over time proved my success. That is my track record of succeeding at learning, developing and performing new quantitative research analysis.

Hi nice readinng your blog